Mobile Application
UTH developed an application, which is used to monitor all the wireless devices (wifi, 3G BS, 3G femtocell, WiMAX and LTE in the near future) and measure the channel state of each interface (RSSI levels), data traffic (uplink, downlink), handover conditions (e.g. when and under which conditions there is a handover from the 3G BS to the 3G femtocell), etc. This information will be gathered by the interaction of the application directly with the wireless interfaces drivers.
The additional property that UTH mobile tool has to offer is that the application can send those info/ measurements to an OML database located at NITOS server. The architecture that is used as a model for the deployment can be found in Measurement Architecture for Network Experiments with Disconnected Mobile Nodes, NICTA Australian Technology Park.
So far, UTH has managed to create a service that:
- Samples data from the mobile interface (signal strength, SNR, network type, operator name).
- Samples data from the WiFi interface (signal strength, bssid, ssid, capabilities, channel).
- Stores the data in separate schemas in a local database.
- Creates a connection to a remote web OML server and uses OML text protocol to push the data in.
- Depicts the sampling measurements on a Google map.
- Creates a graph from the sampling measurements.
Below, instances of the applications GUI and applications functionality are presented. We provide the reader with snapshots of the application and measurements taken at our lab. Moreover, a brief description of the applications elements is provided.
Application Schematic
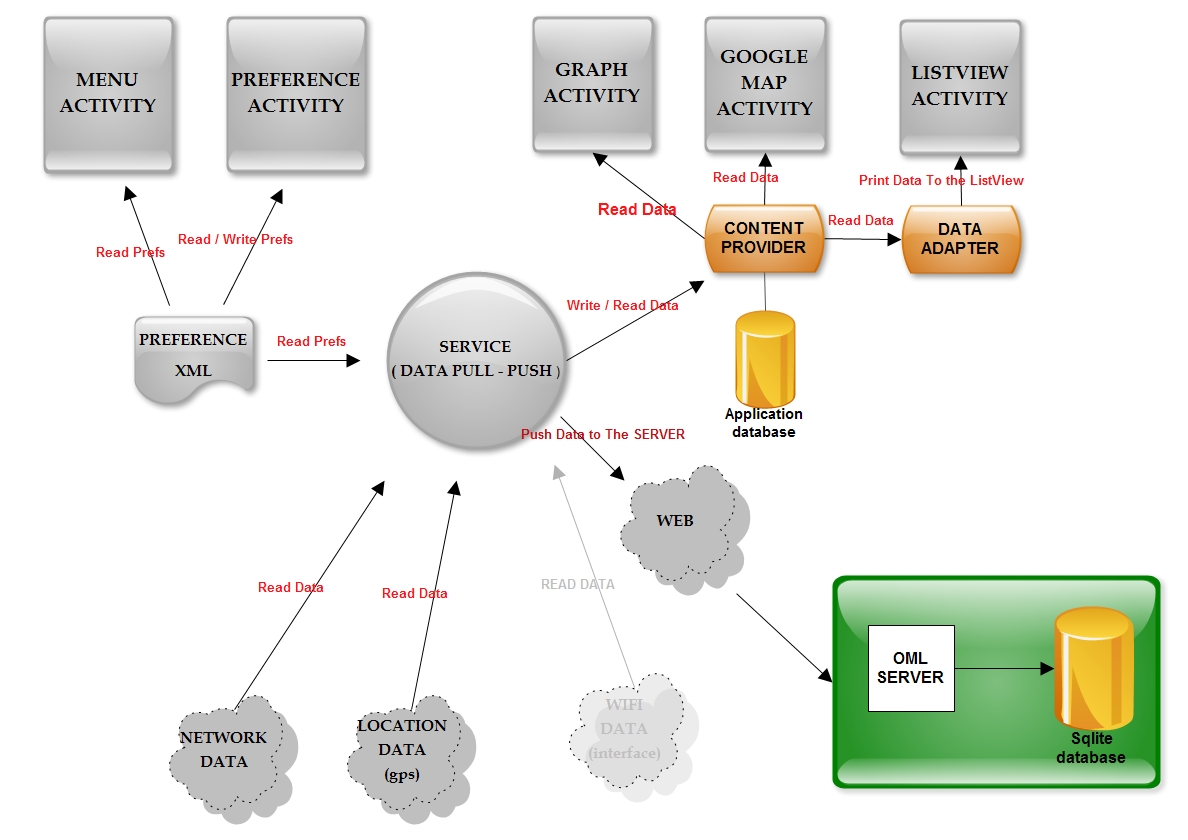
- Background Service: The service is the main tool of the application. It runs in the background and samples the wireless interfaces. In order the service to run smoothly the user must make the appropriate modifications in the Preferences menu. The service stores the data in a local database, and if the user wants to, on an OML server database. At any time s/he can access the stored data and view them using a graph or a list view.
- OML server: The application uses the OML Text Protocol in order to connect and store sampling data in our OML server (NITOS). The user can choose whether the remote connection will take place through the wifi interface or 3G interface. It is our objective not to charge the users with unwanted costs.
The interaction with the user is possible through a simple yet self explanatory and well designed GUI. The user starts the interaction with the application’s main screen. This screen provides a menu functionality that gives him/her the choice to adjust the preferences under his/her demands. Figures 11a, 11b and 11c present the functionality described.
Application GUI
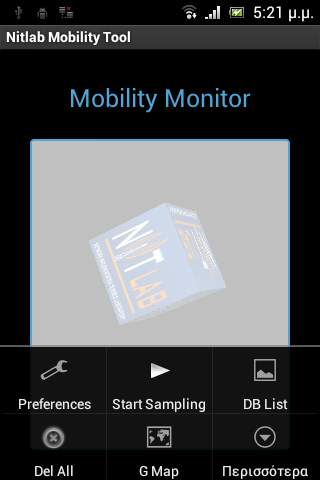
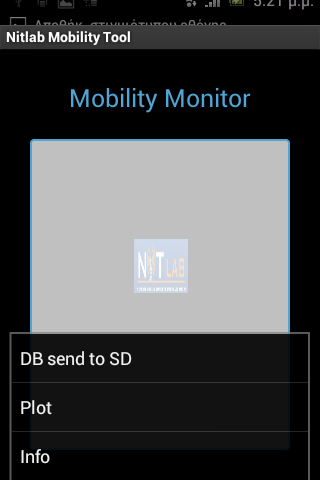
- Applications main screen
- Menu and available operations:
- Preferences: here the user gives the parameters requested by the application in order the service to run smoothly.
- Start Sampling: start the sampling process in background
- DB List: generate a list view of the data stored in the local database
- Del All: delete all the data that are stored in the database
- G Map: map the measurements you collected on a google map
- DB send to SD: extract the local database to the sd card of the phone
- Plot: choose an arithmetic variable to make its graph
- Info: general info about the application
- Text Box : shows the events that are triggered, e.g. the signal strength or the network type that is changing.
Preferences
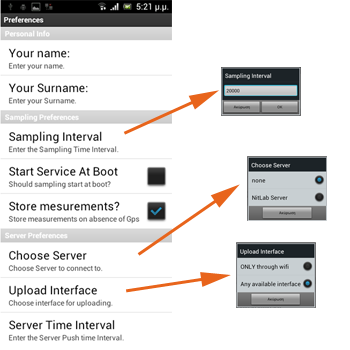
- Personal Info:The name and surname are used for the creation of a unique DB into the OML server.
- Sampling Preferences:The user can choose the measurement frequency, if the sampling preference should start when the phone boots and if the measurements will be saved to DB even when there are no GPS data.
- Server Preferences:The user chooses whether or not to send the data to a server. The user can also choose how often to send data to the server and through which interface (WiFi or 3G, under development).
After the service stops or while it is running, the user can use the graph tool or the google map tool and explore the measurements obtained by the sampling process. A short description of this functionality is presented below.
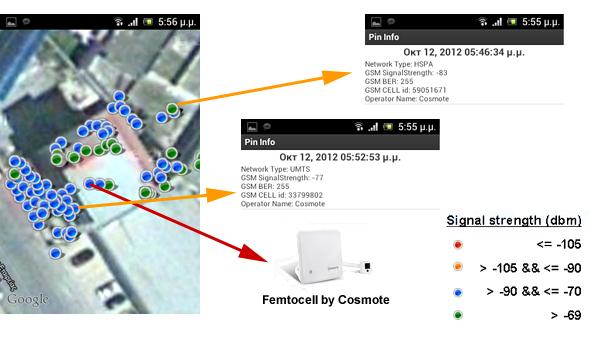
The above measurements have been taken in our lab. We are equiped with several femtocells provided by cosmote and several phone numbers are subscribed on this service. An android phone runs the application collecting RSSI measurents while a real user carries the device around. Then, we depict the measurements at a google map and we use four different pins to devide signal level to bad or low, medium, good, excellent.
Each green pin represents the user, having connection through 3G femtocell and each blue pin means connection through 3G BS. The femtocell is using the HSPA protocol while the 3G BS is recognized as a UMTS network. The user can tap on every pin, if s/he wishes to, and observe the data stored in the database concerning that GEO point. The red arrow indicates the location of the femtocell device.
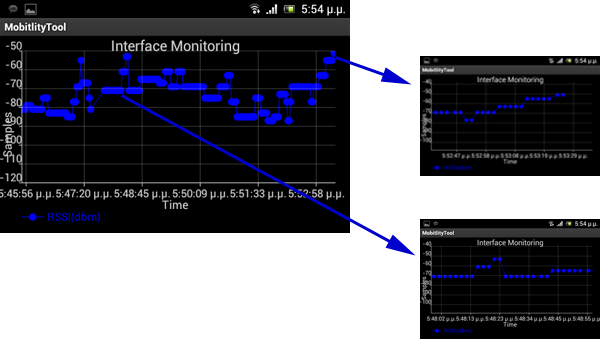
Wether the sampling service is stopped or is running the user can see the graph of the available arithmetic variables. As an example we post the graph of the RSSI. The measurements are the same we used to create the google map above. The user can see the graph as a whole, or zoom in and have a closer look.
Graph Functionality
Sensor Platform Integration
Android Based Smart hand held devices host various sensors and give the user the ability to use them at will. Nevertheless, there are occasions when the user needs a larger variety of sensors or diversity in sampling rates or sampling sensitivity. As a result, third party open source platforms, like arduino, can be customized accordingly and provide the necessary interfaces.
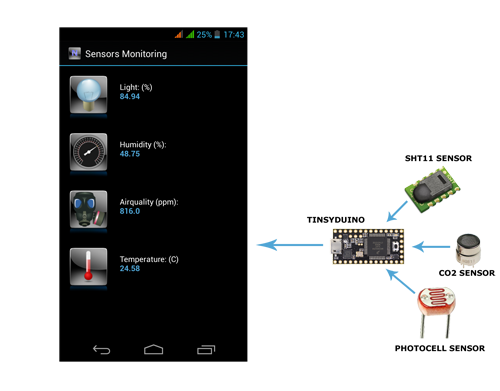
NITLab used the Tinsyduino platform, an arduino based microcontroller, in order to mount a serious of compatible sensors, i.e. humidity, temperature, light and C02. The platform was programmed so as to perform a per-second sampling, for each one of the sensors, and synthesize a string structure composed of all the sampled values and formatted to a csv style.
In order to transmit the values from the Tinsyduino to the Android phone we used the usb to serial functionality supported by the Smartphone. On the side of the Smartphone, the values were depicted through the usage of a graphical interface and a plotting mechanism. In advance, a background mechanism allowed the storage of the measurements on a local, as well as a remote database, for posterior processing.
The aforementioned platform is fully scalable and could support a wide number of sensors according to the needs of the user and the capabilities and restrictions of the Tinsyduino microcontroller.
Developer: Igoumenos Ioannis