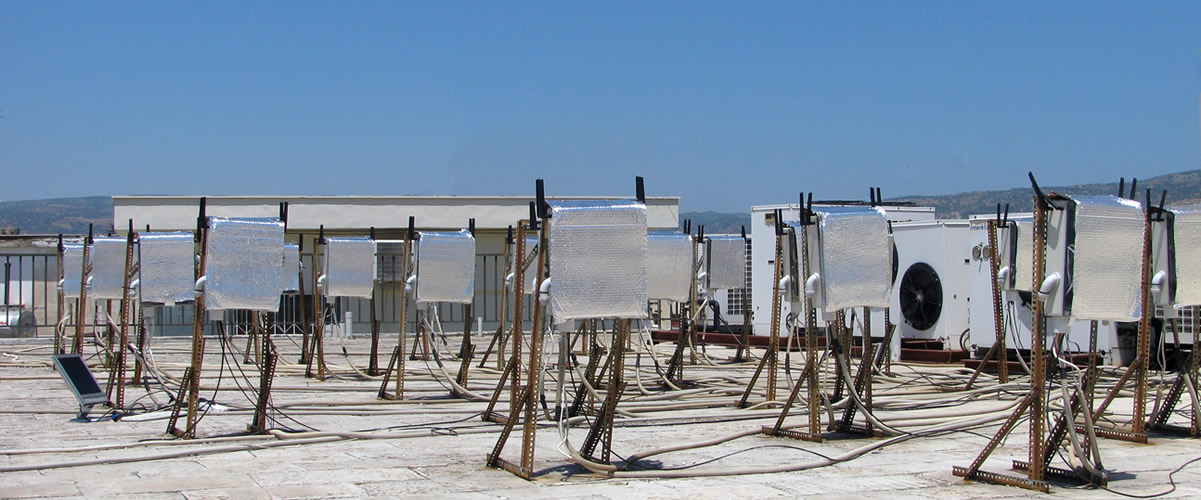
NITOS Outdoor deployment consists of powerful nodes that feature multiple wireless interfaces and allow for experimentation with heterogeneous (Wi-Fi, WiMAX,
UTH developed an application, which is used to monitor all the wireless devices (wifi, 3G BS, 3G femtocell, WiMAX and LTE in the near future) and measure the channel state of each interface (RSSI levels), data traffic (uplink, downlink), handover conditions (e.g. when and under which conditions there is a handover from the 3G BS to the 3G femtocell), etc. This information will be gathered by the interaction of the application directly with the wireless interfaces drivers.
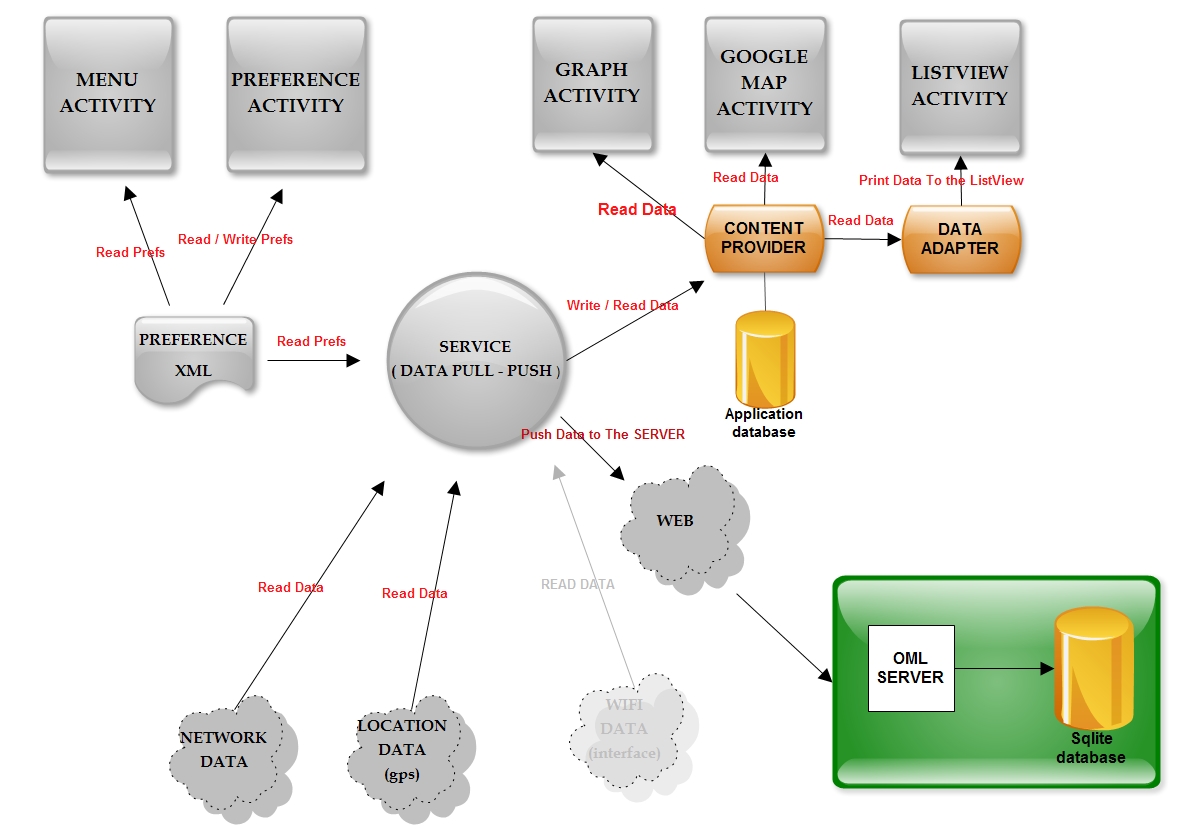
The additional property that UTH mobile tool has to offer is that the application can send those info/ measurements to an OML database located at NITOS server. The architecture that is used as a model for the deployment can be found in Measurement Architecture for Network Experiments with Disconnected Mobile Nodes, NICTA Australian Technology Park.
So far, UTH has managed to create a service that:
Samples data from the mobile interface (signal strength, SNR, network type, operator name).
Samples data from the WiFi interface (signal strength, bssid, ssid, capabilities, channel).
Stores the data in separate schemas in a local database.
Creates a connection to a remote web OML server and uses OML text protocol to push the data in.
Depicts the sampling measurements on a Google map.
Creates a graph from the sampling measurements.
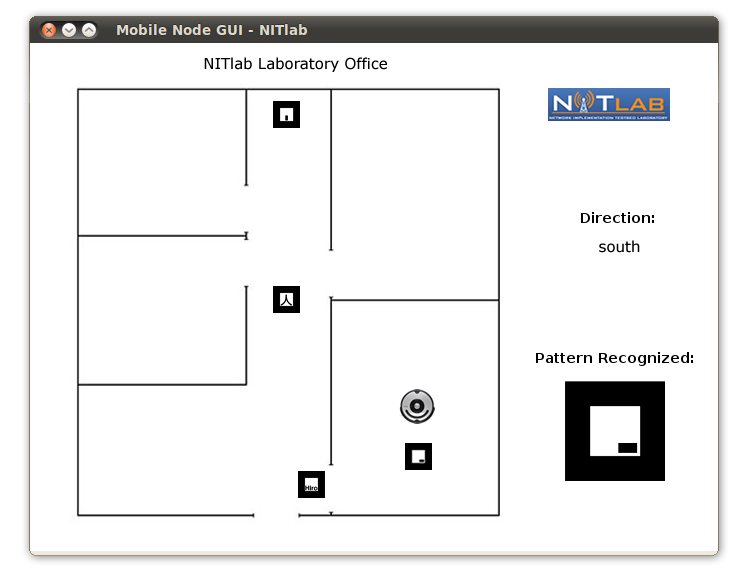
Below, instances of the applications GUI and applications functionality are presented. We provide the reader with snapshots of the application and measurements taken at our lab. Moreover, a brief description of the applications elements is provided.
Mobile Node
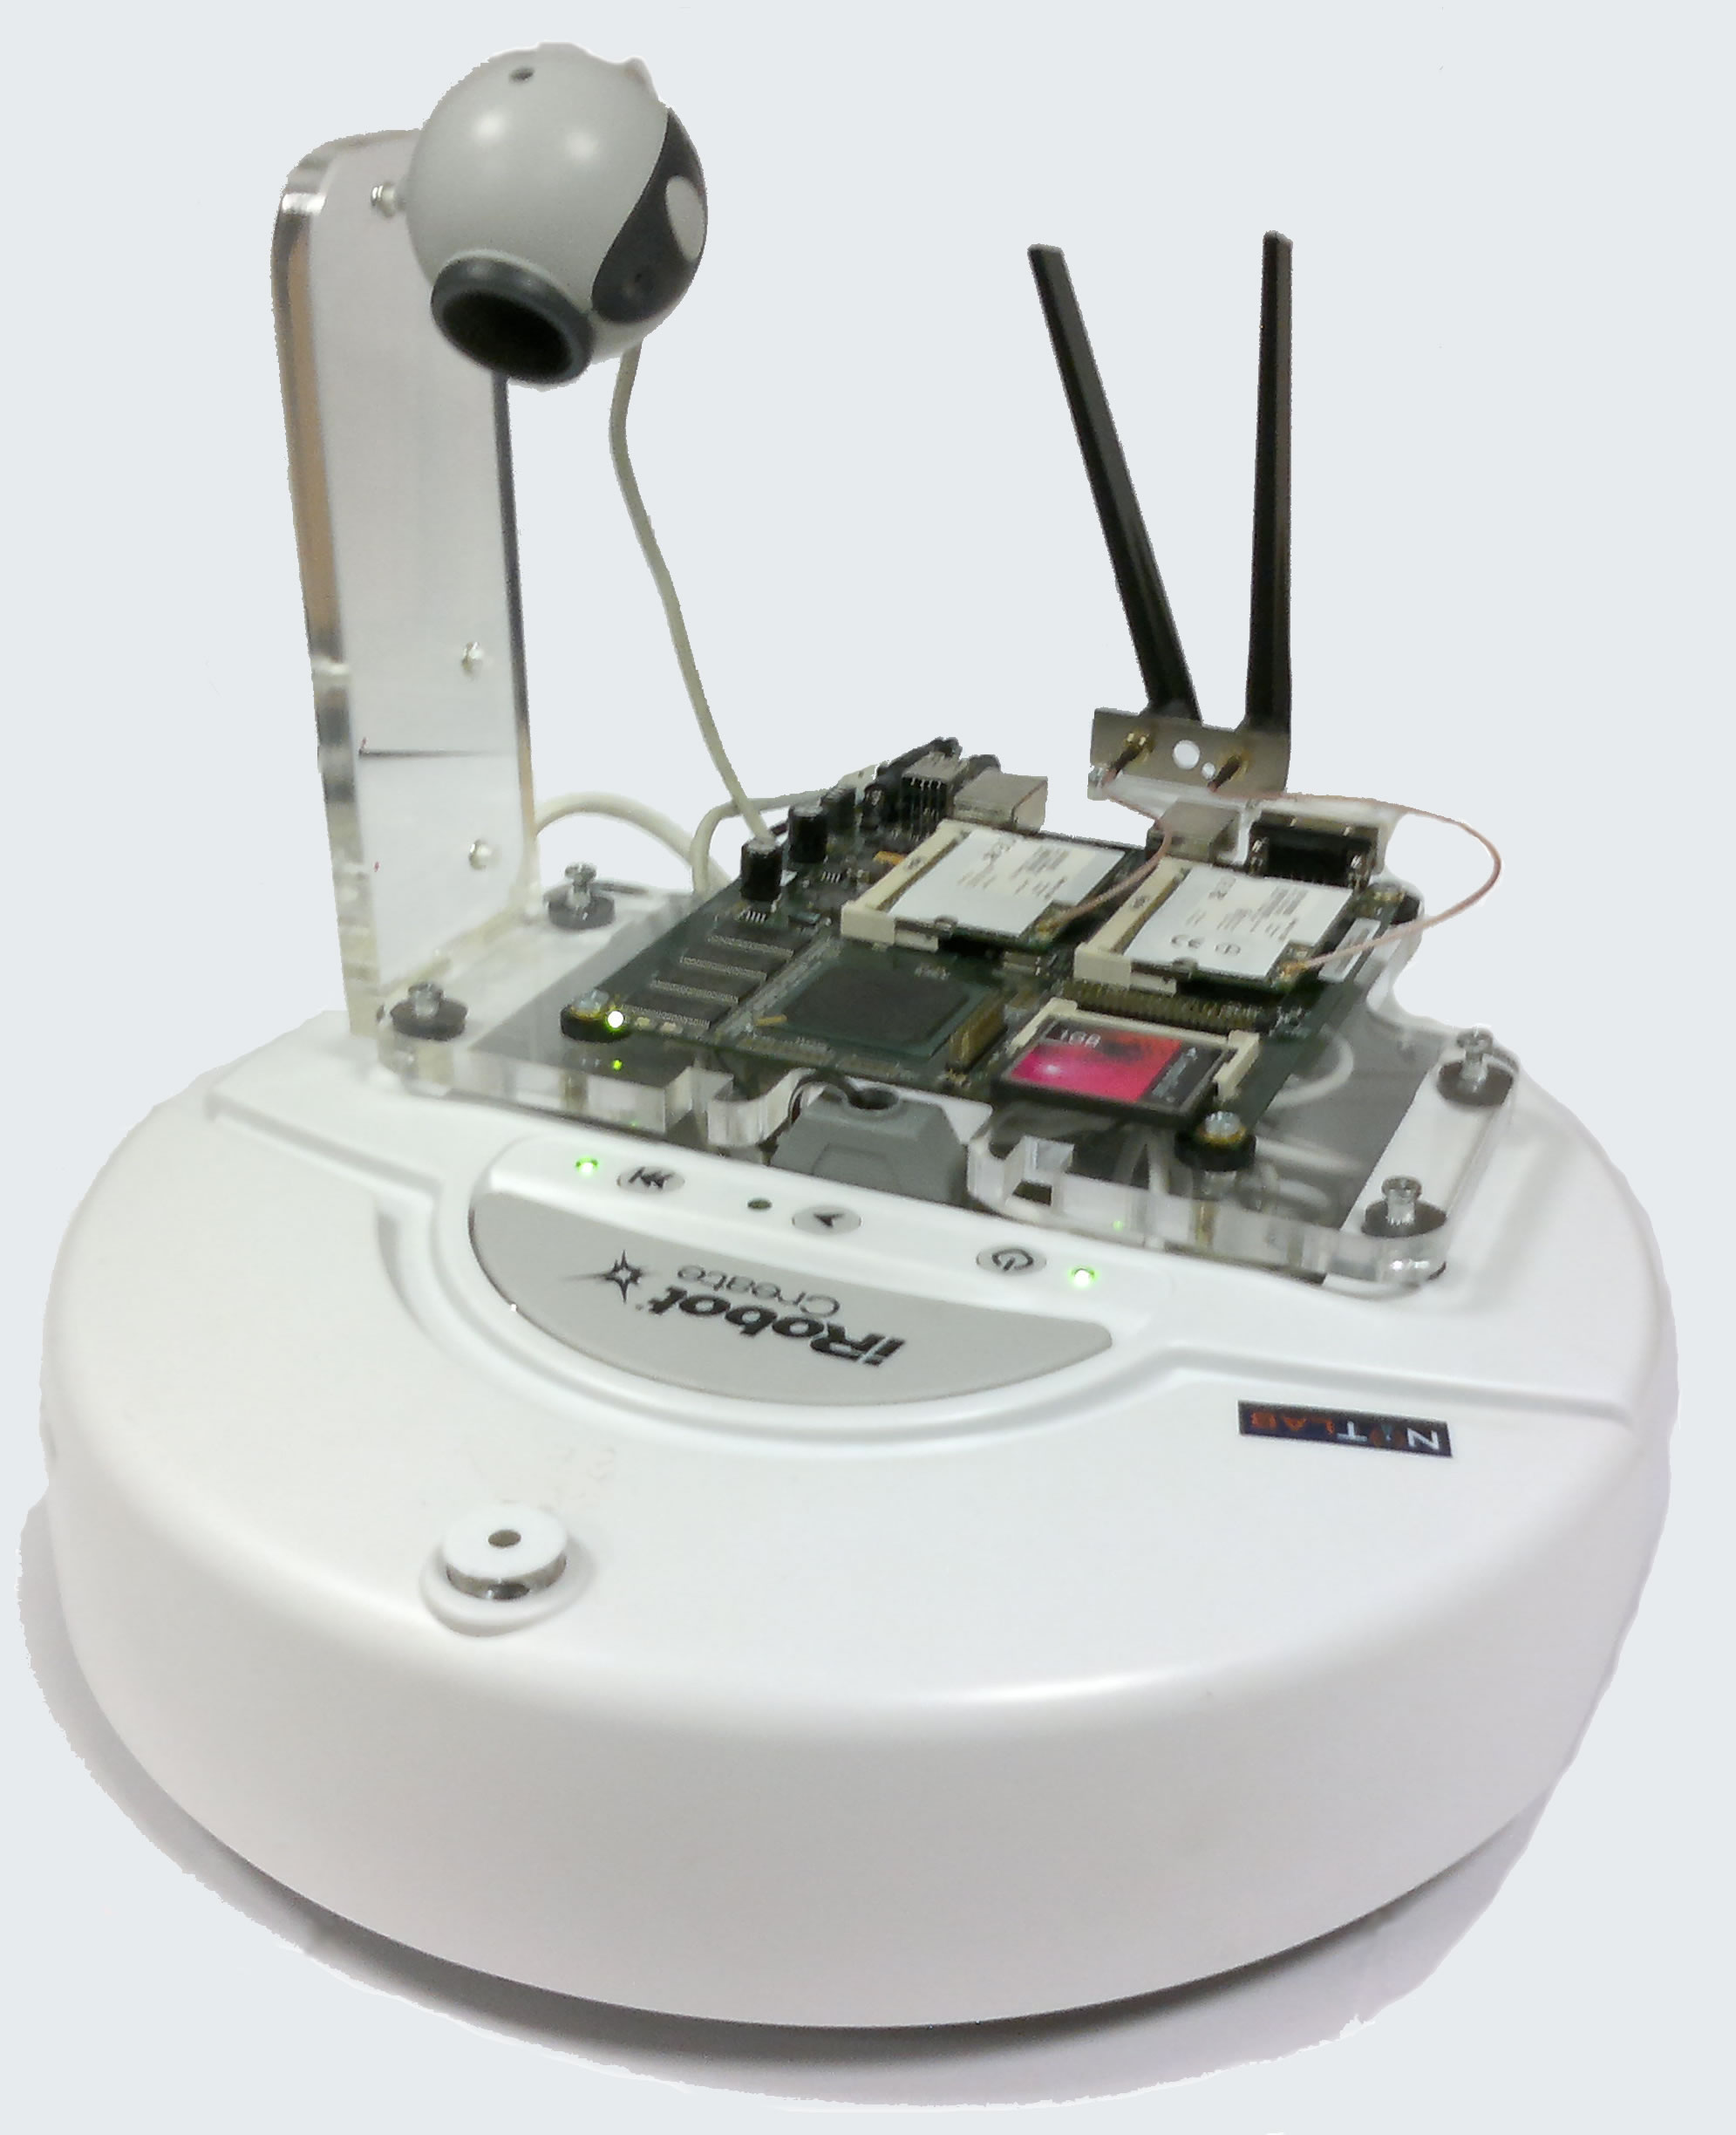
Due to the necessity of mobile experiments at NITOS, UTH has developed a prototype mobile node. We exploit iRobot Create platform and an Alix motherboard, which is mounted on it. The mobile node is also equipped with a camera, which is used to recognize predefined patterns that are located in certain places in our Laboratory. The mobile node navigates in the room and after recognizing a specific pattern it does a specific movement (turn right/left, stop).
Alix motherboard features two wireless interfaces (Atheros AR5006). The first is used to control the node while it provides wireless communication in order to configure the predefined movements and start moving the robot, while the second one can be used for experimentation. The motherboard is powered off by the robot’s battery and is highly power-efficient.
Currently, we are in the process of expanding the abilities of our mobile node by training the camera software in order to be able to recognize more patterns by using orientation tracking, so that the user is informed about the exact angle under which the specific pattern is detected. Moreover, we plan to develop five additional robots and deploy them in the new testbed that we are developing.
Dynamic Frequency Selection through Collaborative Reporting in WLANs
Performance experienced by end-users, in densely populated urban areas, is significantly degraded due to contention and interference among adjacent cells. In order to address this challenge, various studies have proposed mechanisms for allocating the available number of channels to cells. In infrastructure 802.11 WLANs, channel selection is performed solely by the AP. Most implemented approaches result in static channel assignments, which is not consistent with the dynamic nature of the wireless medium.
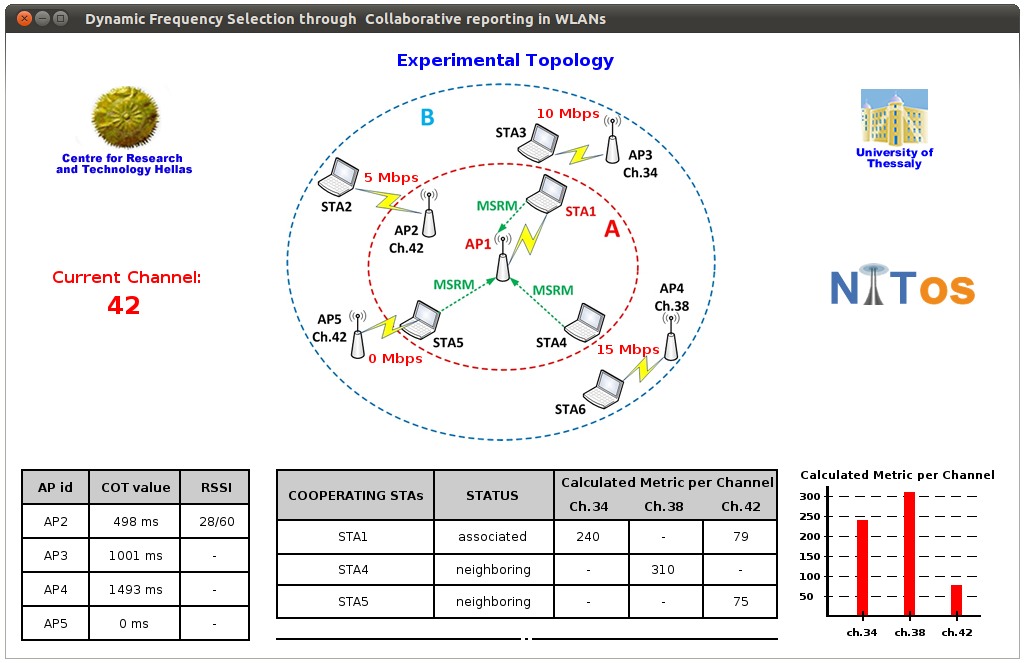
In this video demonstration, we present a frequency selection algorithm implemented in the Mad-WiFi open source driver that dynamically switches the operational channel by taking into account both channel as well as tra ffic conditions. The proposed algorithm features a novel collaborative reporting mechanism, which enables nodes of the cell, as well as nodes belonging to different cells, to contribute to interference measurements. Based on this mechanism the APs decide on frequency selection more accurately and moreover manage to detect "hidden" APs. Compared to current approaches our algorithm manages to improve total network through- put, up to a factor of 7.5. For the purposes of this demo we use a graphical user interface to demonstrate an online frequency selection experiment that is remotely executed in NITOS wireless testbed.
1. The DFS Experiment
In this experiment we consider a network that consists of 5 APs and 6 STAs. We design a network setup that consists of 4 different BSSs operating on channels of the 5 GHz band. Each one of these 4 BSSs consists of one AP and one associated STA, where AP2 and AP5 are statically assigned Ch. 42, AP3 channel 34 and AP4 Ch.38. These 4 BSSs are used to generate interference conditions of controlled traffi c. Moreover, we setup AP1 that runs our algorithm to decide about its operating channel. Through driver level modifications, we limit the set of available channels to the three used by the interfering APs. Among the various phases of the experiment, we sequentially activate the various features of our mechanism, starting from the default algorithm of Mad-WiFi and ending with the full activation of our algorithm. The aim of this experiment is to estimate how different features of our mechanism cope with the interference that we generate. The three phases are described below.
2a. Phase 1
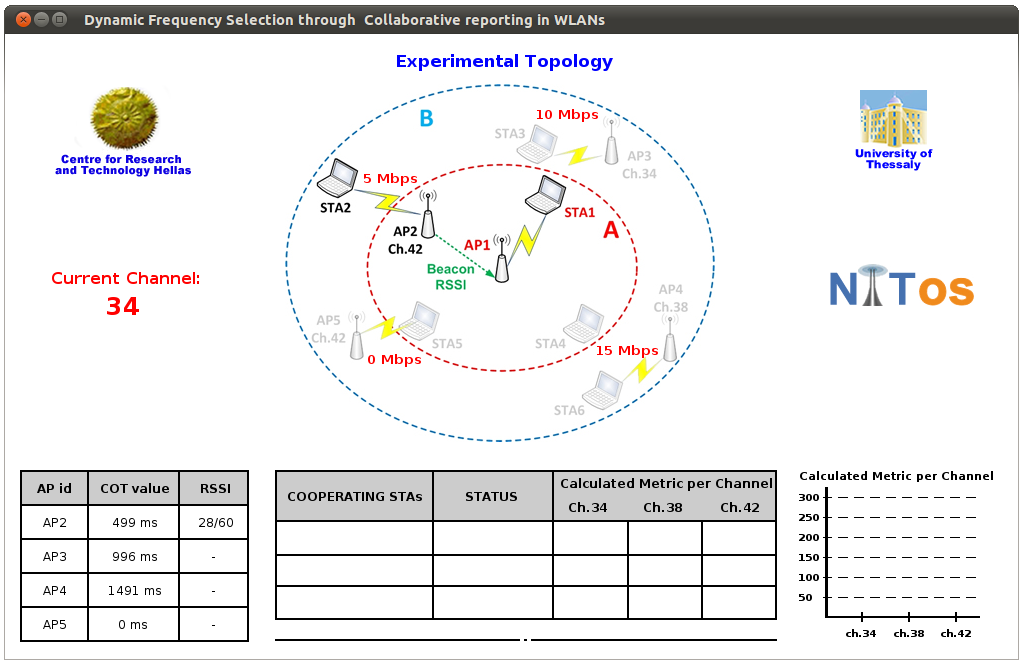
In the first phase of the experiment, we use the default Mad-WiFi algorithm. The AP chooses (time 1:10) to avoid Ch. 42, since this is the only one that presents RSSI values, based solely on its measurements. The original driver performs the scanning in the order 34-38-42 and as a result selects channel 34 as it offers zero RSSI values.
Figure 1: Phase 1- Default Mad-WiFi
2b. Phase 2
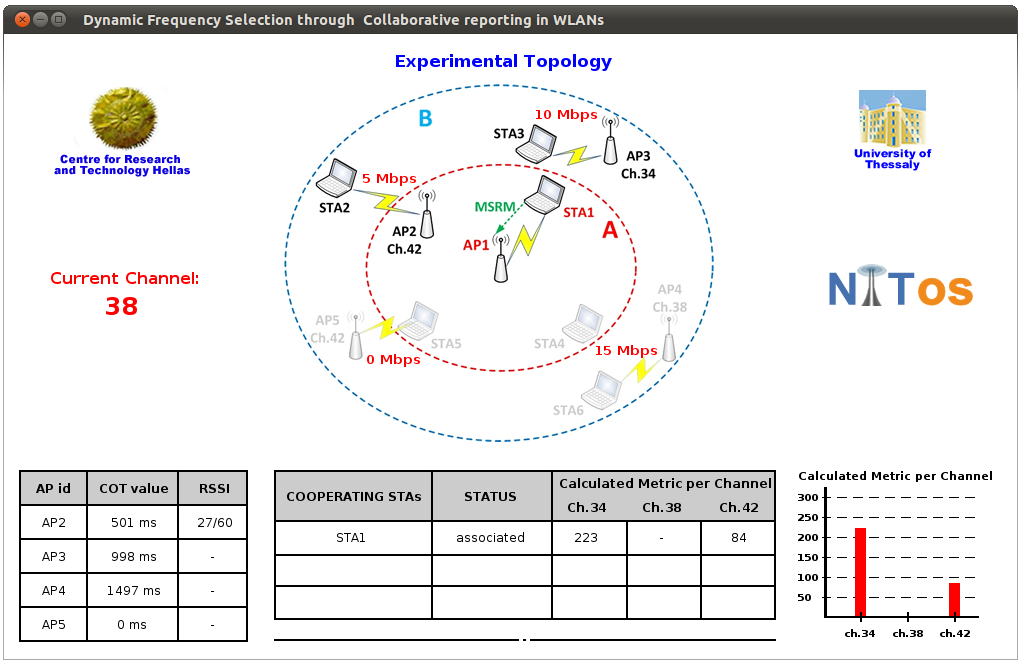
During the next phase, the client-feedback feature of our mechanism is enabled (time 2:14). This approach involves STA1 in interference estimation as well. The AP manages to detect AP3 operating on Ch.34 through consideration of measurements reported by STA1 (time 2:34) and thus decides to avoid it. Consequently, AP1 decides to operate on Ch. 42 (time 2:50), which still offers zero RSSI values.
Figure 2: Phase 2 - Client feedback from associated STAs
2c. Phase 3
In the last phase, we utilize the feature of our implementation that enables STAs belonging to neighboring cells to exchange Measurement Reports (time 3:02). According to this approach, AP1 utilizing measurements from a total of 2 neighboring STAs manages to detect both of AP4 and AP5. As a result, it decides to switch its channel to Ch. 42, as this offers the lowest calculated metric (time 3:20).
Figure 3: Phase 3 - Client feedback from both associated and neighboring STAs
Having determined the proper channel selections according to the version of our algorithm that runs in each phase, we proceed with a representation of the throughput performance that each channel selection results in. In order to provide these results, we execute an o ff-line experiment, during which we manually switch among the available channels and repeatedly activate a downlink saturated flow from AP1 to STA1. The results obtained through this off-l ine experiment (time 5:29) validate that the proposed scheme results in channel selections that deliver the highest available throughput in all cases.
3. Related paper
You can also download the relevant paper accepted in Tridentom 2012:
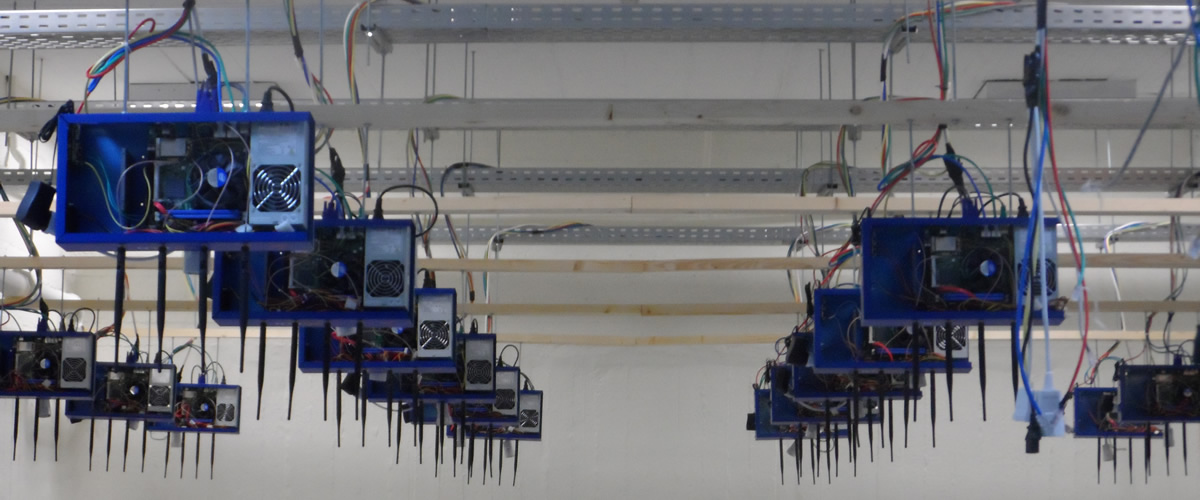
 Each blade server has