• 1
  • 2
  • 3
  • 4

Activities

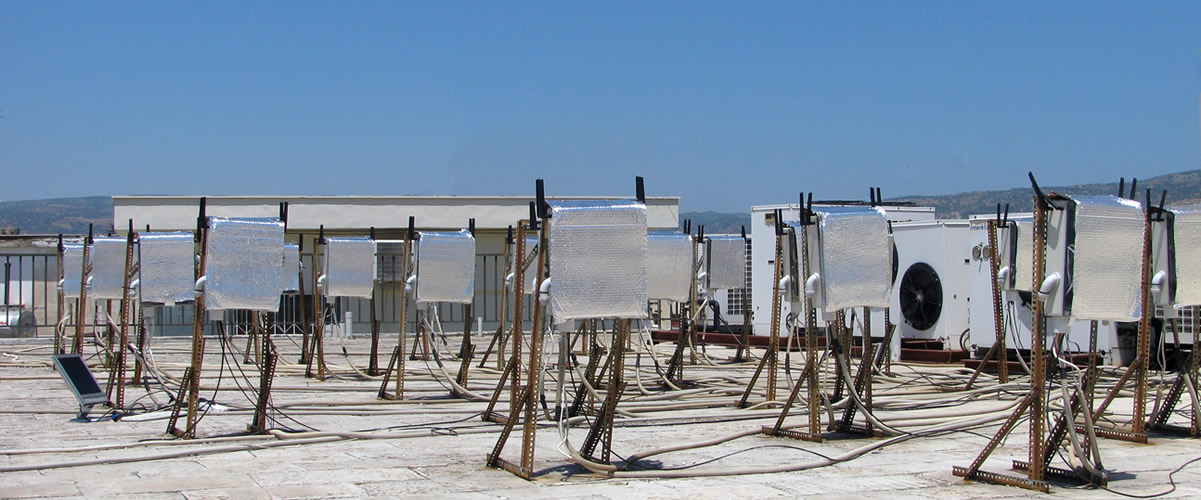
  • NITOS Outdoor deployment consists of powerful nodes that feature multiple wireless interfaces and allow for experimentation with heterogeneous (Wi-Fi, WiMAX,

    Read More
  • The setup NITOS testbed is currently using is a fixed setup (employing no mobility between BSs) that does not require

    Read More
  • Towards the development of a remote accessible LTE testbed, where experimenters from all the word will be able to run

    Read More
  • NITOS facility provides remote access to OpenFlow switches (2 x Pronto 3290 , 2 x HP 3800 ), enabling the user to create

    Read More
  • NITlab developed a software defined radio (SDR) testbed that consists of 18 Universal Software Radio Peripheral (USRP) devices attached to

    Read More
  • NITOS is an Intelligent Transport System (ITS) compatible facility thanks to the implementation of the key components of the ITS

    Read More
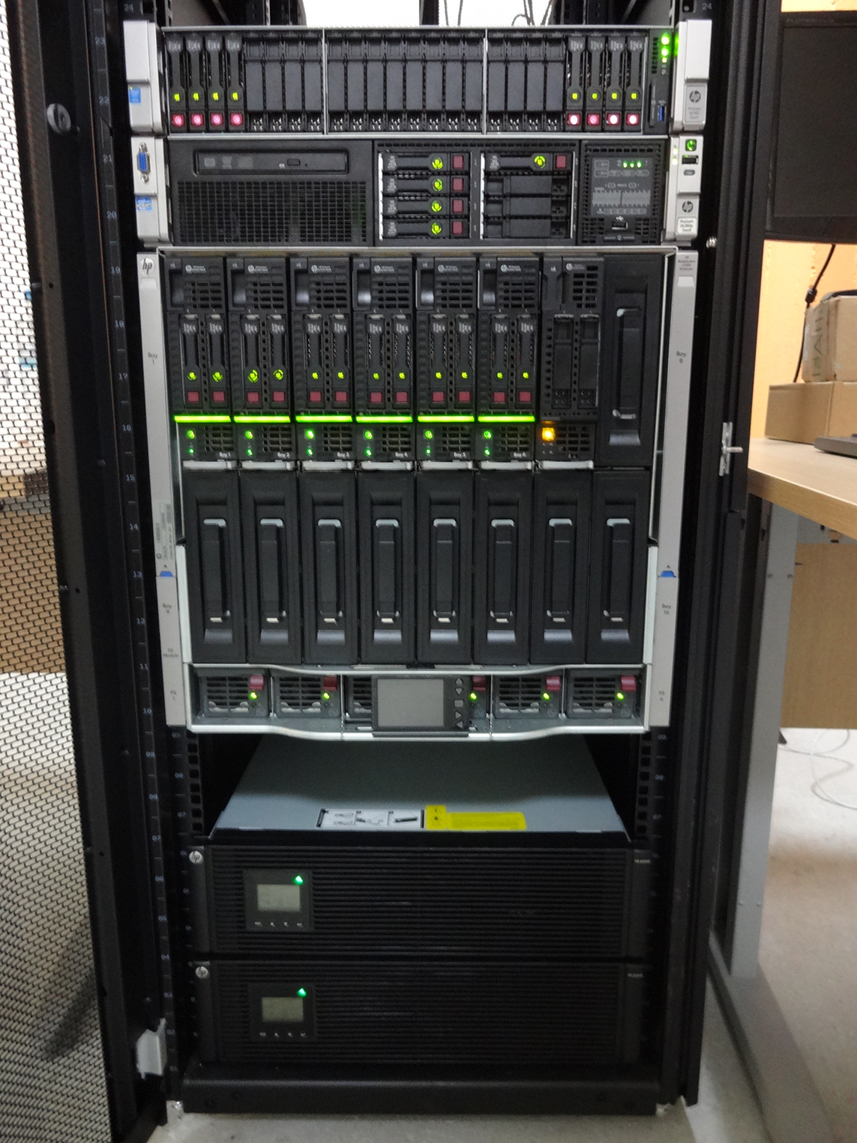
  • NITOS cloud infrastructure is based on HP GEN8 blade servers and one HP DL380p GEN8 server. Cloud Infrastructure UTH Each blade server has

    Read More

NITOS

The Future Internet Facility

  • Outdoor Testbed

    Experiments under real world environment Read More
  • Indoor Testbed

    Experiments in RF isolated environment Read More
  • Office testbed

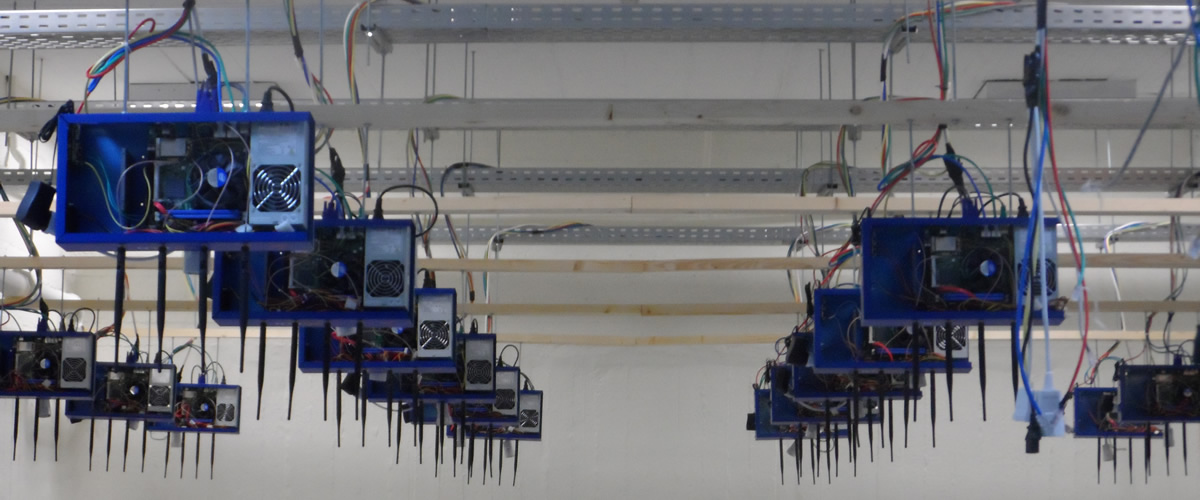
    Experiments in an office environment Read More
  • 1
  • 2
  • 3

FGRE: Collecting Performance Statistics

Now that you are connected to the network, you can start collecting measurements regarding the link quality. As the nodes are physically located in the same building, but in different floors and rooms, you can notice significant differences among the statistics collected from the nodes.

In order to retrieve statistics from the dongle and push them to a database server you will have to send the following command:

 
root@node044:~# wmxstat --oml-domain fgre-teamX.1 --oml-collect tcp:10.64.44.232:3003

where X is the number of your team. The statistics collected from the USB dongle are:

  • The Base Station ID that the dongle is associated to
  • The Received Signal Strength Indicator (RSSI)
  • The Carrier to Interference plus Noise Ratio (CINR)

In the following links you can find out more on RSSI and CINR.

The server that the measurements are collected is the same that you used previously for the visualization part. You can visualize the results at that server with the following command:

ruby1.9.1 -I lib example/fgre/simple_viz_server.rb start --db fgre-teamX.1 -p 300X

and by visiting the webpage indicated.

 

<< Previous Page         Next Page >>

What Our Experimenters Say

  • NITOS is a very reliable and well managed platform. The offered infrastructure and features are great. The management team is very supportive.

    Mustafa Al-Bado
    Postdoctoral researcher
    Insight centre, University College Cork (UCC)
  • 1
  • 2
 
uth
image
image
image


Login Form