NITLab developed a Power Meter framework consisted of Power Meter Devices and respective User Interface. This framework is capable of sampling the Power Consumption of a connected electric device. Moreover, it can sense environmental conditions using a temperature and humidity sensor and a light intensity photo-resistor sensor as well. The sensed data are transmitted to NITOS server through a Gateway node for further processing.

The Power Meter Device features:
- Arduino Pro Micro microcontroller board.
- ATMega 32U4 running at 3.3V/8MHz.
- Programmable through Arduino IDE.
- ACS712 current sensor that provides precise current measurements.
- Electrical Power Relay.
- Xbee S2 module for wireless communication.
- Sht11 temperature & humidity sensor.
- Light intensity photo-resistor sensor.
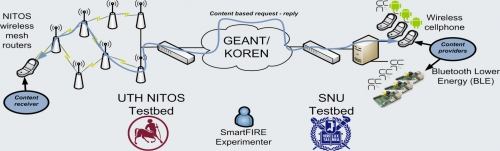
Network Architecture
Each plug has attached an electric device which the experimenter/user needs to to control or measure its power consumption. The microcontroler collects the results including the environmental measurements as well. Through the wireless interface each plug sends the measurements to a Gateway. The Gateway collects the measurements from all the associated devices and sends the data to the central NITOS Server through the Internet. The server processes the measurements and stores them in a database. Users are able to view the data through the provided web interface.

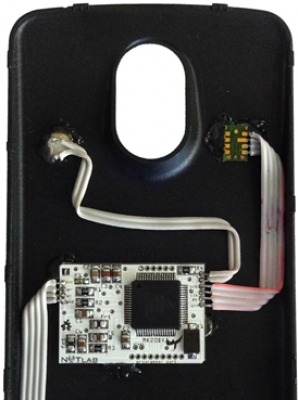
The designed PCB

Users are able to view the collected measurements (current power consumption as well as environmental measurements) through a web-based graphical interface.

Moreover, through the same web interface the experimenters can remotely manage the plugs using the provided control panel. In this way they are able to turn them on or off, to reset and calibrate each plug individually. In addition, the users have the ability to change the sampling paramenter of each plug. Such parameters are the samples per period, the periods per measurement and the sampling interval.

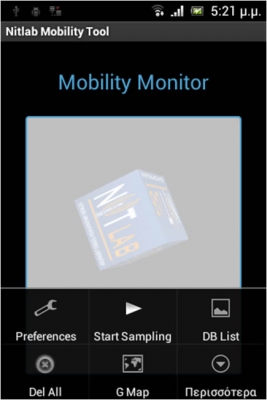
Finally, an Android application had been developed in order to control the plugs in an alternative and more practical way. The application provides to the experimenter the aforementioned control panel. In this way he is able to control or monitor the plugs through his Android phone. In the picture below you can see a screenshot of the application.

Demo Poster: http://nitlab.inf.uth.gr/NITlab/papers/Power_poster.pdf